Below are example charts showing a student’s progress over time.
These charts use a logarithmic, or “multiply”, scale in order to accommodate a very wide range of rates of behaviors (for example, from 1/week to 100,000/week ) on the same chart.
While the methodology of the scale may be unfamiliar to some users, the main point is to be able to see the consistent decrease in inappropriate and undesirable behaviors, while seeing the consistent increase in positive behaviors.
Parents, guardians, and representatives of referring agencies may view the charts of their student or client via a link from our main website.
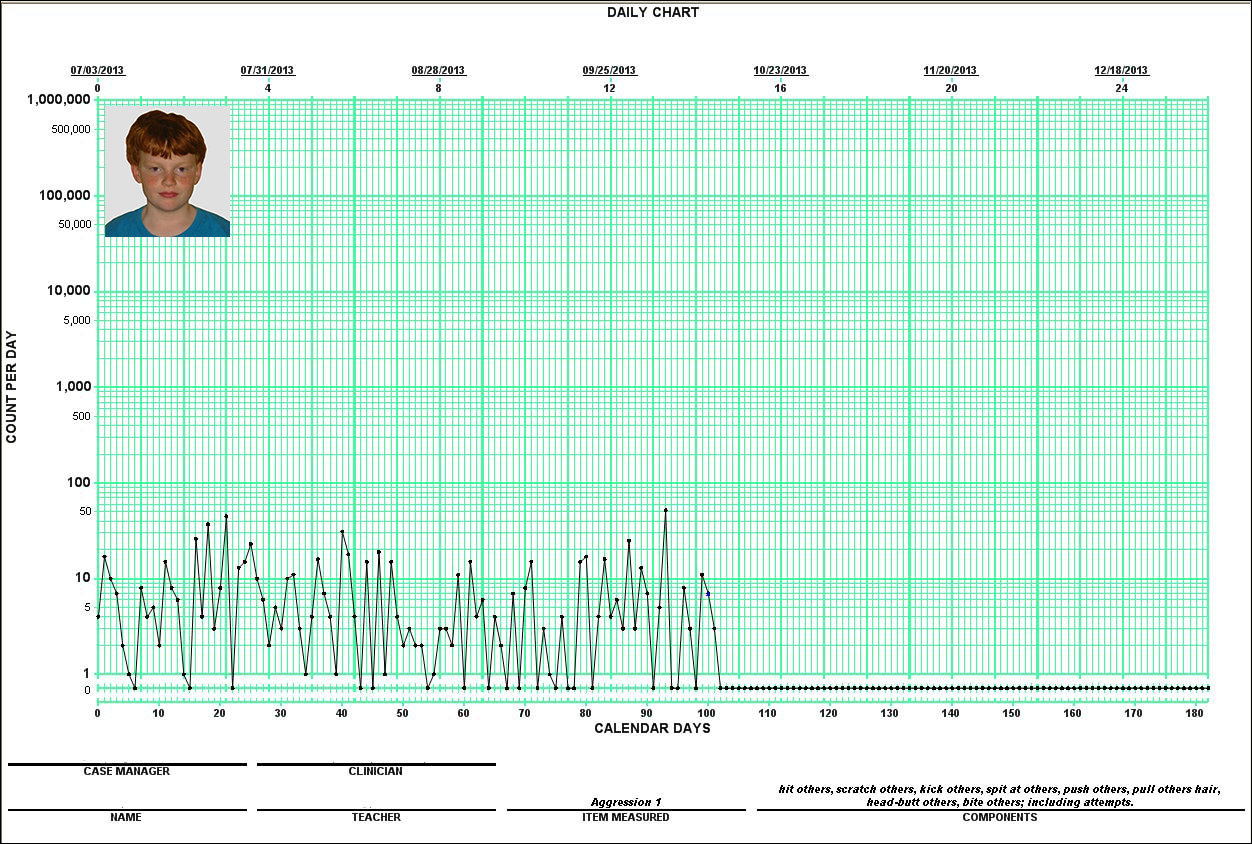
Daily Chart
Daily chart tracking the student’s exhibit of “major inappropriate” behaviors – in this case, aggression – as listed in the Components line.
Weekly Chart
Weekly chart showing consistently decreasing major inappropriate behaviors.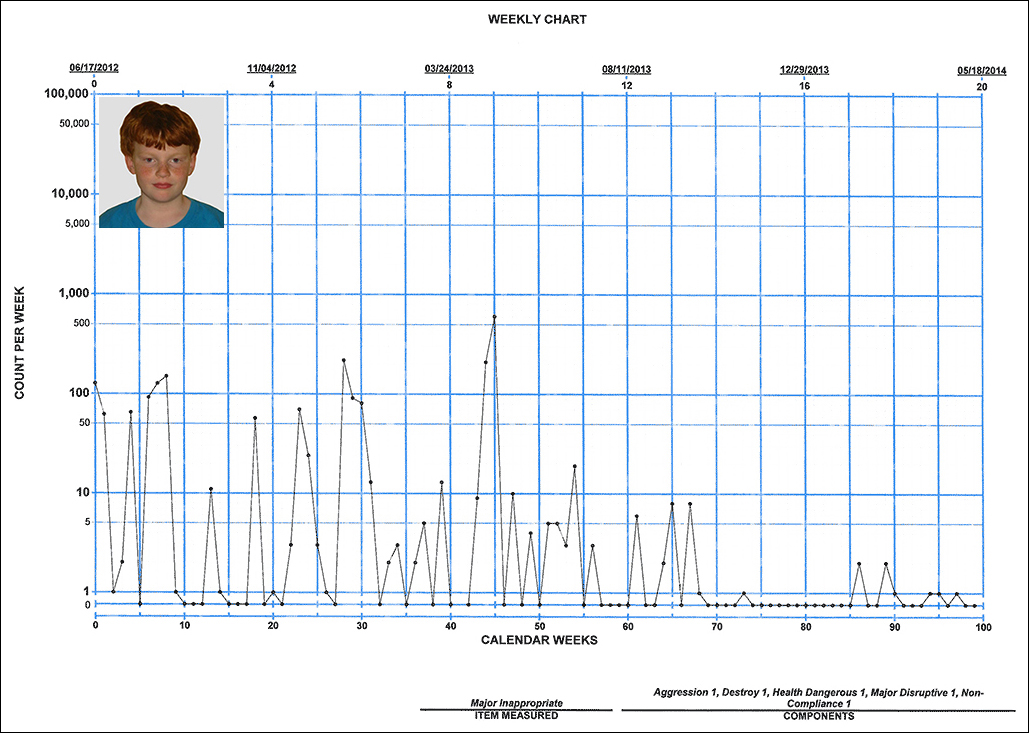
Monthly Chart
The Monthly Chart gives an even clearer picture of the consistent decrease over time in the student’s major inappropriate behaviors.
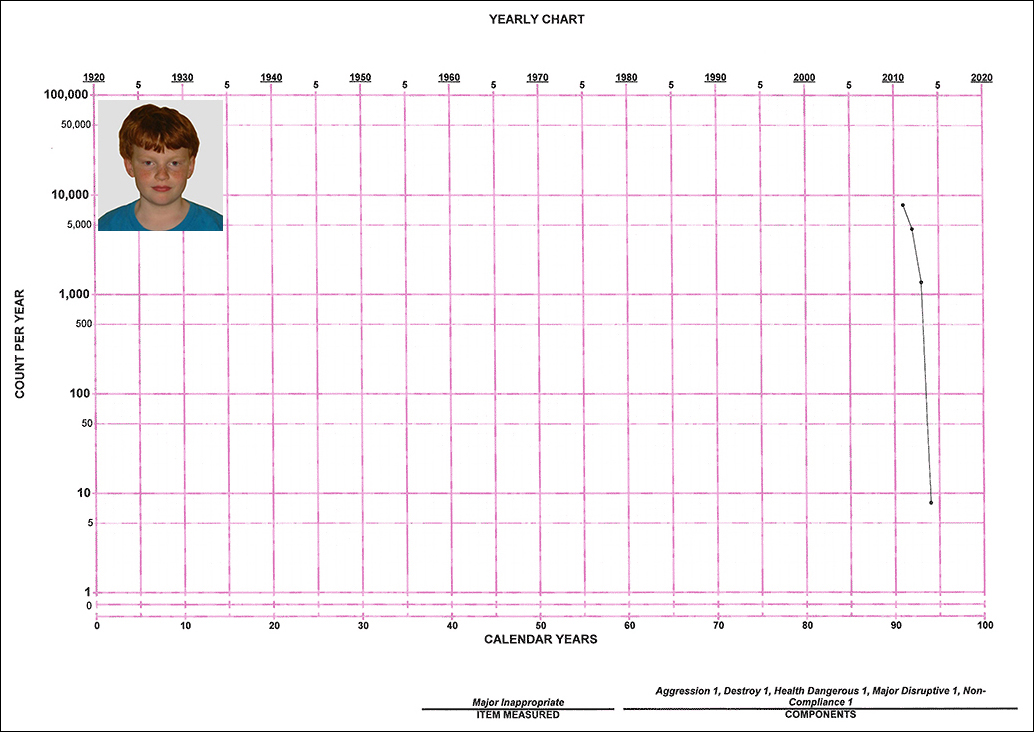
Yearly Chart
Lastly, the Yearly Chart shows most clearly of all the student’s ability to continue on a path of improvement.